[Kaggle실습] A/B Testing / cookie_cats dataset EDA
2024. 12. 11. 02:43ㆍ카테고리 없음
import numpy as np
import pandas as pd
import seaborn as sns
import matplotlib.pyplot as plt
import os
from scipy.stats import shapiro
import scipy.stats as stats
path = 'C:/Users/82106/Desktop/코드 리뷰/data/archive (3)/cookie_cats.csv'
def load(path, info = True):
import pandas as pd
import io
if len(path.split(".csv")) > 1:
read = pd.read_csv(path)
elif len(path.split(".xlsx")) > 1:
read = pd.read_excel(path)
if info:
if len(read) > 0:
print("# Data imported!")
print("# ------------------------------------", "\n")
print("# DIMENSIONS -------------------------")
print("Observation:", read.shape[0], "Column:", read.shape[1], "\n")
print("# DTYPES -----------------------------")
if len(read.select_dtypes("object").columns) > 0:
print("Object Variables:", "\n", "# of Variables:",
len(read.select_dtypes("object").columns), "\n",
read.select_dtypes("object").columns.tolist(), "\n")
if len(read.select_dtypes("integer").columns) > 0:
print("Integer Variables:", "\n", "# of Variables:",
len(read.select_dtypes("integer").columns), "\n",
read.select_dtypes("integer").columns.tolist(), "\n")
if len(read.select_dtypes("float").columns) > 0:
print("Float Variables:", "\n", "# of Variables:",
len(read.select_dtypes("float").columns), "\n",
read.select_dtypes("float").columns.tolist(), "\n")
if len(read.select_dtypes("bool").columns) > 0:
print("Bool Variables:", "\n", "# of Variables:",
len(read.select_dtypes("bool").columns), "\n",
read.select_dtypes("bool").columns.tolist(), "\n")
print("# MISSING VALUE ---------------------")
print("Are there any missing values? \n ", np.where(read.isnull().values.any() == False,
"No missing value!", "Data includes missing value!"), "\n")
buf = io.StringIO()
read.info(buf=buf)
info = buf.getvalue().split('\n')[-2].split(":")[1].strip()
print("# MEMORY USAGE ---------------------- \n", info)
else:
print("# Data did not import!")
return read
ab = load(path, info = True)
ab.head()

pandas 라이브러리를 사용하여 데이터를 로드
탐색하는 함수 load를 정의
1. 파일읽기
2. 정보출력
- 데이터가 정상적으로 로드되었는지 확인 메시지 출력.
- 데이터셋의 차원은 행과 열의 개수
- 데이터 타입 별 변수 목록 : 문자열, 정수, 실수, 불리언 타입을 분류하여 출력
- 결측값 존재 여부 출력
- 메모리 사용량 출력
fig, axes = plt.subplots(1, 3, figsize = (18,5))
ab[(ab.version == "gate_30")].hist("sum_gamerounds", ax = axes[0], color = "steelblue")
ab[(ab.version == "gate_40")].hist("sum_gamerounds", ax = axes[1], color = "steelblue")
sns.boxplot(x = ab.version, y = ab.sum_gamerounds, ax = axes[2])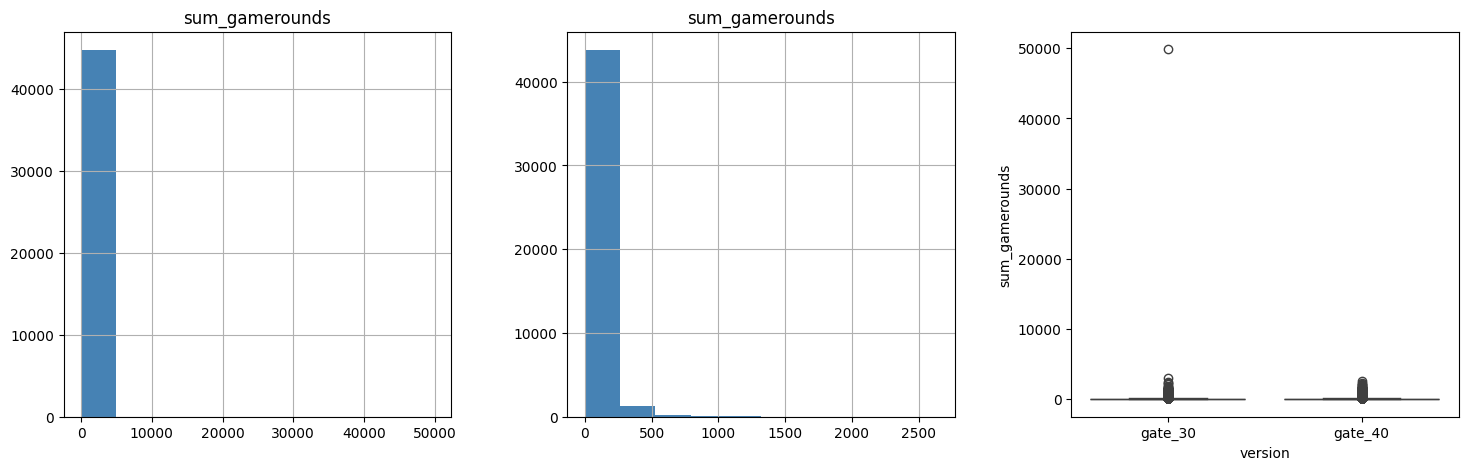
ab[ab.version == 'gate_30'].reset_index().set_index("index").sum_gamerounds.plot(legend=True, label="Gate 40")
plt.suptitle("Before Removing The Extreme Value", fontsize = 20);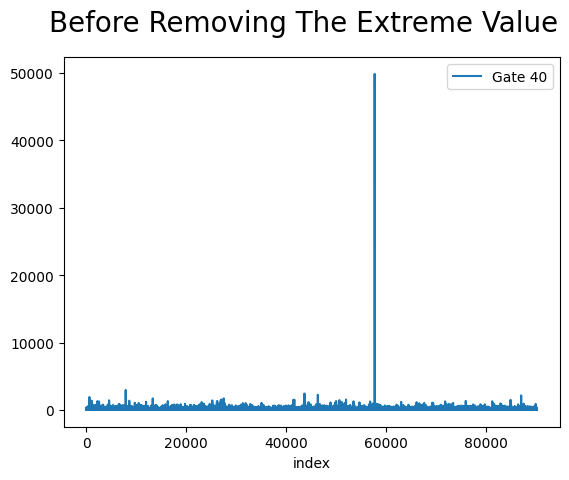
ab = ab[ab.sum_gamerounds < ab.sum_gamerounds.max()]

# Summary Stats: sum_gamerounds
ab.describe([0.01, 0.05, 0.10, 0.20, 0.80, 0.90, 0.95, 0.99])[["sum_gamerounds"]].T
countmeanstdmin1%5%10%20%50%80%90%95%99%maxsum_gamerounds
| 90187.0 | 51.287991 | 102.225151 | 0.0 | 0.0 | 1.0 | 1.0 | 3.0 | 16.0 | 67.0 | 134.0 | 221.0 | 493.0 | 2640.0 |
from matplotlib.pyplot import hist

fig, axes = plt.subplots(1, 4, figsize = (18,5))
ab.sum_gamerounds.hist(ax = axes[0], color='steelblue')
ab[(ab.version == 'gate_30')].hist("sum_gamerounds", ax=axes[2], color='steelblue')
sns.boxplot(x=ab.version, y=ab.sum_gamerounds, ax=axes[3])

plt.suptitle("이상치 값 제거 후")
axes[0].set_title("전체 게임라운드 분포", fontsize=20)
axes[1].set_title("게이트 30 분포", fontsize = 15)
axes[2].set_title("게이트 40 분포",fontsize=15)
axes[3].set_title("두 그룹의 분포", fontsize=15)